

Abstract
In this experiment we will study the process of beta decay, measurements
of the shape of beta ray spectrum and determination of beta spectrum end-point
energy by graph a kurie or Fermi plot. Also, we will calculate the resolution
of the spectrometer by using the internal conversion peaks.
Introduction
The three
common decay modes of nuclei (α, β, and γ) were all observed by the early
twentieth century. When a nucleus decays, all the conservation laws must be
observed: mass-energy, linear momentum, angular momentum, and electric charge.
To these laws we add another one for radioactive decay, called the conservation
of nucleons. It states that the total number of nucleons (A, the mass number)
must be conserved in a low-energy nuclear reaction (say, less than 938 MeV) or
decay. Neutrons may be converted into protons, and vice versa, but the total
number of nucleons must remain constant.
Radioactive decay may occur for a nucleus when some other combination of the A nucleons has a lower mass. Let the radioactive nucleus A XZ be called the parent and have the mass M (A X Z). Two or more products can be produced in the decay. The study of Beta decay as well as Alpha and Gamma signaled the start of the nuclear physics and led to the prediction of the existence of the neutrino.
Radioactive
decay occurs because some nuclides are not stable. In Figure1 we showed a plot
of stable nuclei. In many cases alpha decay leaves the daughter nucleus farther
from the line of stability than the parent. Unstable nuclei may move closer to
the line of stability by undergoing beta decay. The simplest example of beta
decay is the decay of a free neutron.
n → P + β-
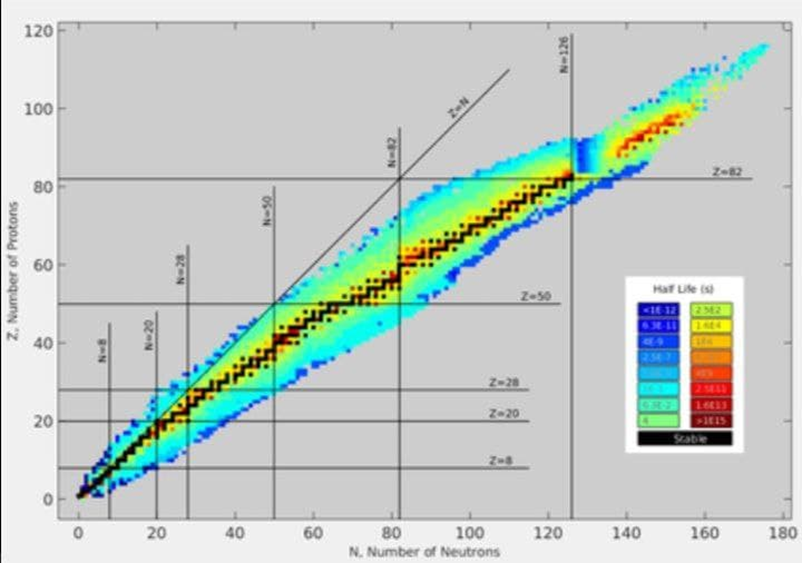
Figure 1: A plot of the known nuclides with neutron number N versus proton number Z. The solid points represent stable nuclides, and the shaded area represents unstable nuclei. A smooth line through the solid points would represent the line of stability.

In order to
incorporate these features, Fermi formulated a field theory for β decay. The
Fermi theory assumes that the β decay of a nucleus proceeds via the β decay of
one of the nucleons making up the nucleus. It thus predicted the following
basic nuclear β decay processes:
.png)
In this
experiment the beta ray spectrometer utilizes a magnetic field (B) which
deflects the
particles in a path of known curvature through an angle 1800 between two points (the source and the detector) spaced at a distance 2r apart. The 1800 point on the trajectory is called the "first order focus" because electrons emitted with small angular deviations from normal tend to be focused at 1800.
For most of
the beta-decay particles, relativistic relations connecting the momentum and
kinetic energy must be used in the calculations, i.e.
.png)
Thus if the
rest mass of the particle is known, its energy can be deduced from the measured
momentum using the spectrometer. An electron with velocity v entering a
region where there is a magnetic field B , such that v is
perpendicular to B suffers a
magnetic force:
FM = evB = (mv^2)
/ r
P = mv = eBr
Combining
this equations we get:
.png)
The spectrum of 𝜷 decay is continuous, so it cannot be used to calibrate the energy measurements taken
by the spectrometer with good precision. Some beta sources produce a
mono-energetic spectral line in addition to the continuous beta spectrum. These
mono-energetic electrons are due to a transition process known as internal
conversion.
The internal
conversion arises when one or more nucleons in the nucleus rearrange themselves
during a transition from an initial to a final state. The nuclear energy (Ei -
Ef) is transferred directly to an atomic electron bound in the atom with an
energy Ex where x is the atomic shell (K, L, M, … etc.) or emits γ-radiations,
because these processes are independent. Fig. 3 shows the spectrum of 137Cs
which consists of a continuous spectrum and a spectral line. Note the
continuous part (due to beta decay) and the monoenergetic lines (due to
"internal conversion" resulting in the ejection of an electron from
the K and L shells). Usually the spectrometer is calibrated and its resolution
is measured by the study of the internal conversion electron spectra. The
conversion electron energies Ee for K and L shell of 137Cs are 624.2 keV and
656.0 keV [3], respectively

Methodology

Apparatus:
1. Beta ray
source 137Cs.
2. End
window Geiger counter.
3. Scaler to
count the emitted beta particles.
4. Rotary
vacuum pump to evacuate the chamber housing the source and the counter.
5. Electromagnet with its power supply.
Procedure:
1. Use the
rotary pump to evacuate the vacuum chamber in order to reduce the collisions
between the b particles and the air molecules.
2. Be sure
that the end window Geiger counter is operated within its plateau region.
Higher voltages will damage the counter. Note: Do not exceed 500 volts on the
Geiger counter used in this experiment.
3. With no
magnet current flowing, take the background counting rate for a period of at
least 15 minutes.
4. Raise the
magnet current gradually and take the number of the counts per 3 minutes N(p)
for different values of the magnetic fields B (or the magnet current I).
5. Make sure
that you continue increasing the magnet current until you obtain a broad peak
and a sharp peak.
Data Analysis
Calculate Pe and Ee for each value of
the magnetic field B.
the background value corresponds
to I=0 the table below shows the corrected
count rate number which is the counts number taken every 300 sec – the
background value .
to calculate the value of B use this equation
B(mT) = -23.88I^2 + 19.54I^2 + 147I + 1.253
To convert it to Gauss use the relation:
1Gauss=10^-4
R=1.5inch=3.81cm
|
current(A) |
N/300sec |
N |
B
(GAUSS) |
B*r(Gauss.cm) |
|
0 |
120 |
0 |
12.53 |
47.7393 |
|
0.02 |
172 |
52 |
42.00625 |
160.0438125 |
|
0.04 |
149 |
29 |
71.62736 |
272.9002416 |
|
0.06 |
166 |
46 |
101.62736 |
387.2002416 |
|
0.08 |
168 |
48 |
131.2583 |
500.094123 |
|
0.1 |
195 |
75 |
161.2452 |
614.344212 |
|
0.12 |
264 |
144 |
191.3311 |
728.971491 |
|
0.14 |
345 |
225 |
221.5046 |
843.932526 |
|
0.16 |
338 |
218 |
251.7541 |
959.183121 |
|
0.18 |
388 |
268 |
282.0683 |
1074.680223 |
|
0.2 |
425 |
305 |
312.4356 |
1190.379636 |
|
0.22 |
444 |
324 |
342.8446 |
1306.237926 |
|
0.24 |
458 |
338 |
373.2839 |
1422.211659 |
|
0.26 |
480 |
360 |
403.7419 |
1538.256639 |
|
0.28 |
417 |
297 |
434.2072 |
1654.329432 |
|
0.3 |
450 |
330 |
464.6684 |
1770.386604 |
|
0.32 |
429 |
309 |
495.114 |
1886.38434 |
|
0.34 |
403 |
283 |
525.5324 |
2002.278444 |
|
0.36 |
403 |
283 |
555.9124 |
2118.026244 |
|
0.38 |
360 |
240 |
586.2423 |
2233.583163 |
|
0.4 |
324 |
204 |
616.5108 |
2348.906148 |
|
0.42 |
342 |
222 |
646.7063 |
2463.951003 |
|
0.44 |
292 |
172 |
676.8175 |
2578.674675 |
|
0.46 |
239 |
119 |
706.8328 |
2693.032968 |
|
0.48 |
191 |
71 |
736.7408 |
2806.982448 |
|
0.5 |
170 |
50 |
766.53 |
2920.4793 |
|
0.51 |
173 |
53 |
781.3765 |
2977.044465 |
|
0.52 |
160 |
40 |
796.189 |
3033.48009 |
|
0.53 |
129 |
9 |
810.966 |
3089.78046 |
|
0.54 |
175 |
55 |
825.7062 |
3145.940622 |
|
0.55 |
199 |
79 |
840.4082 |
3201.955242 |
|
0.56 |
389 |
269 |
855.0703 |
3257.817843 |
|
0.57 |
461 |
341 |
869.6914 |
3313.524234 |
|
0.58 |
541 |
421 |
884.2698 |
3369.067938 |
|
0.59 |
512 |
392 |
898.8042 |
3424.444002 |
|
0.6 |
449 |
329 |
913.2932 |
3479.647092 |
|
0.61 |
331 |
211 |
927.7353 |
3534.671493 |
|
0.62 |
178 |
58 |
942.129 |
3589.51149 |
|
0.63 |
163 |
53 |
956.373 |
3643.78113 |
|
0.64 |
155 |
35 |
970.7695 |
3698.631795 |
|
0.65 |
136 |
16 |
985.0061 |
3752.873241 |
|
0.66 |
141 |
21 |
1232.1227 |
4694.387487 |

This graph represents the beta spectrum , it's a continuous spectrum with two monochromatic energy lines ,k and L shells resulting from internal conversion electrons. The first peak corresponding to k shell electrons occurred at current 0.58 A , the second peak corresponding to L-shell electrons occurred at 0.60 A .
|
N |
P |
Ee(Mev) |
T(Mev) |
p^2 |
(n/p^2)^1/2 |
|
|
0 |
0.014319 |
0.511201 |
0 |
0.000205 |
0 |
|
|
52 |
0.048004 |
0.51325 |
0.00225 |
0.002304 |
150.231 |
|
|
29 |
0.081854 |
0.517514 |
0.006514 |
0.0067 |
65.79025 |
|
|
46 |
0.115856 |
0.523969 |
0.012969 |
0.013423 |
58.54018 |
|
|
48 |
0.149998 |
0.53256 |
0.02156 |
0.022499 |
46.18904 |
|
|
75 |
0.184266 |
0.543208 |
0.032208 |
0.033954 |
46.9986 |
|
|
144 |
0.218648 |
0.555813 |
0.044813 |
0.047807 |
54.8827 |
|
|
225 |
0.253129 |
0.570259 |
0.059259 |
0.064074 |
59.2584 |
|
|
218 |
0.287697 |
0.586422 |
0.075422 |
0.08277 |
51.3206 |
|
|
268 |
0.32234 |
0.604172 |
0.093172 |
0.103903 |
50.78709 |
|
|
305 |
0.357042 |
0.623378 |
0.112378 |
0.127479 |
154.6787 |
|
|
324 |
0.391793 |
0.643912 |
0.132912 |
0.153502 |
45.9425 |
|
|
338 |
0.426578 |
0.66565 |
0.15465 |
0.181969 |
43.0982 |
|
|
360 |
0.461385 |
0.688474 |
0.177474 |
0.212876 |
41.1232 |
|
|
297 |
0.4962 |
0.712275 |
0.201275 |
0.246214 |
34.7313 |
|
|
330 |
0.53101 |
0.724508 |
0.213508 |
0.281972 |
34.21007 |
|
|
309 |
0.565802 |
0.736948 |
0.225938 |
0.320132 |
31.0681 |
|
|
283 |
0.600563 |
0.7624 |
0.2514 |
0.360676 |
28.0113 |
|
|
283 |
0.635281 |
0.788541 |
0.277541 |
0.403582 |
26.4805 |
|
|
240 |
0.669941 |
0.815293 |
0.304293 |
0.448821 |
23.1243 |
|
|
204 |
0.704531 |
0.842581 |
0.331581 |
0.496364 |
20.2728 |
|
|
222 |
0.739038 |
0.88437 |
0.37337 |
0.546177 |
20.1608 |
|
|
172 |
0.773448 |
0.912712 |
0.401712 |
0.598222 |
16.9563 |
|
|
119 |
0.807784 |
0.941376 |
0.430376 |
0.652515 |
13.5044 |
|
|
71 |
0.841926 |
0.970311 |
0.459311 |
0.708839 |
10.0081 |
|
|
50 |
0.875969 |
0.999471 |
0.488471 |
0.767322 |
8.0722 |
|
|
53 |
0.892935 |
1.014121 |
0.503121 |
0.797333 |
8.153 |
|
|
40 |
0.909862 |
1.028812 |
0.517812 |
0.827849 |
6.9511 |
|
|
9 |
0.926749 |
1.043537 |
0.532537 |
0.858864 |
3.2371 |
|
|
55 |
0.943594 |
1.058293 |
0.547293 |
0.89037 |
7.8595 |
|
|
79 |
0.960394 |
1.073075 |
0.562075 |
0.922357 |
9.2547 |
|
|
269 |
0.97715 |
1.087878 |
0.576878 |
0.954822 |
16.7847 |
|
|
341 |
0.993858 |
1.102698 |
0.591698 |
0.987754 |
18.5803 |
|
|
421 |
1.010518 |
1.117531 |
0.606531 |
1.021147 |
20.3047 |
|
|
392 |
1.027128 |
1.132373 |
0.621373 |
1.054992 |
19.276 |
|
|
329 |
1.043685 |
1.147219 |
0.636219 |
1.089278 |
17.3791 |
|
|
211 |
1.060185 |
1.162067 |
0.651067 |
1.123992 |
13.7012 |
|
|
58 |
1.076638 |
1.176912 |
0.665912 |
1.159149 |
7.0736 |
|
|
53 |
1.09303 |
1.191751 |
0.680751 |
1.194715 |
6.6604 |
|
|
35 |
1.109363 |
1.20658 |
0.69558 |
1.230686 |
5.3328 |
|
|
16 |
1.125637 |
1.221396 |
0.710396 |
1.267059 |
3.5535 |
|
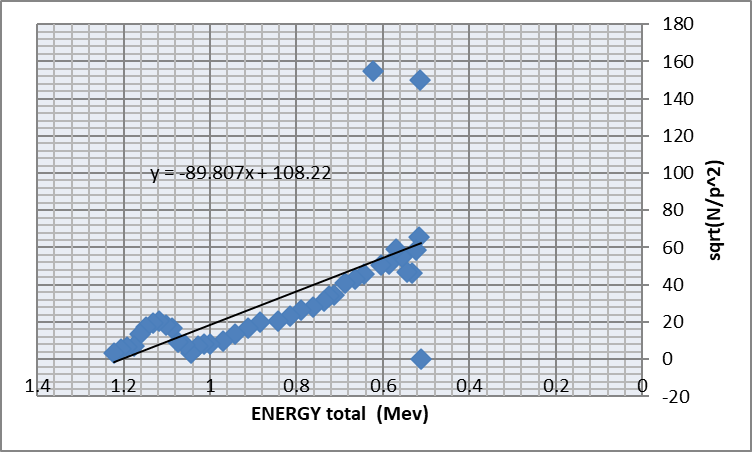
Figure 2: Kurie plot to determine the end point energy (max. energy of
beta particle ).
End point energy = x-intercept = 108.22 / 89.807 = 1.205 MeV
T0 =Etotal-0.511=0.694 Mev
Accepted value of T0 =0.514 Mev
.png)
To estimate the true
value our slope and y-intercept we use the least square method:
|
Ee(Mev) |
(n/p^2)^1/2 |
x*y |
x^2 |
(y-a-bx)^2 |
|
|
0.511201 |
0 |
0 |
0.261326 |
3882.607 |
|
|
0.51325 |
150.231 |
77.10606 |
0.263426 |
7762.393 |
|
|
0.517514 |
65.79025 |
34.04738 |
0.267821 |
16.37521 |
|
|
0.523969 |
58.54018 |
30.67324 |
0.274544 |
6.883991 |
|
|
0.53256 |
46.18904 |
24.59844 |
0.28362 |
201.735 |
|
|
0.543208 |
46.9986 |
25.53002 |
0.295075 |
154.6919 |
|
|
0.555813 |
54.8827 |
30.50452 |
0.308928 |
11.70599 |
|
|
0.570259 |
59.2584 |
33.79264 |
0.325195 |
5.069928 |
|
|
0.586422 |
51.3206 |
30.09553 |
0.343891 |
17.93183 |
|
|
0.604172 |
50.78709 |
30.68414 |
0.365024 |
10.0745 |
|
|
0.623378 |
154.6787 |
96.4233 |
0.3886 |
10494.45 |
|
|
0.643912 |
45.9425 |
29.58293 |
0.414623 |
19.79979 |
|
|
0.66565 |
43.0982 |
28.68832 |
0.44309 |
28.53451 |
|
|
0.688474 |
41.1232 |
28.31225 |
0.473996 |
27.74145 |
|
|
0.712275 |
34.7313 |
24.73824 |
0.507336 |
90.65742 |
|
|
0.724508 |
34.21007 |
24.78547 |
0.524912 |
79.99585 |
|
|
0.736948 |
31.0681 |
22.89557 |
0.543092 |
120.3148 |
|
|
0.7624 |
28.0113 |
21.35582 |
0.581254 |
137.8239 |
|
|
0.788541 |
26.4805 |
20.88096 |
0.621797 |
119.3119 |
|
|
0.815293 |
23.1243 |
18.85308 |
0.664703 |
141.0556 |
|
|
0.842581 |
20.2728 |
17.08148 |
0.709943 |
150.7377 |
|
|
0.88437 |
20.1608 |
17.82961 |
0.78211 |
74.59057 |
|
|
0.912712 |
16.9563 |
15.47622 |
0.833043 |
86.4114 |
|
|
0.941376 |
13.5044 |
12.71272 |
0.886189 |
103.499 |
|
|
0.970311 |
10.0081 |
9.71097 |
0.941503 |
122.571 |
|
|
0.999471 |
8.0722 |
8.06793 |
0.998942 |
107.9169 |
|
|
1.014121 |
8.153 |
8.268129 |
1.028441 |
80.8531 |
|
|
1.028812 |
6.9511 |
7.151375 |
1.058454 |
78.75463 |
|
|
1.043537 |
3.2371 |
3.378034 |
1.088969 |
126.9221 |
|
|
1.058293 |
7.8595 |
8.317654 |
1.119984 |
28.28517 |
|
|
1.073075 |
9.2547 |
9.930987 |
1.15149 |
6.737417 |
|
|
1.087878 |
16.7847 |
18.25971 |
1.183479 |
39.23468 |
|
|
1.102698 |
18.5803 |
20.48846 |
1.215943 |
88.17772 |
|
|
1.117531 |
20.3047 |
22.69113 |
1.248876 |
154.923 |
|
|
1.132373 |
19.276 |
21.82762 |
1.282269 |
162.5886 |
|
|
1.147219 |
17.3791 |
19.93763 |
1.316111 |
148.5326 |
|
|
1.162067 |
13.7012 |
15.92171 |
1.3504 |
96.88369 |
|
|
1.176912 |
7.0736 |
8.325005 |
1.385122 |
20.68918 |
|
|
1.191751 |
6.6604 |
7.937538 |
1.42027 |
29.89883 |
|
|
1.20658 |
5.3328 |
6.43445 |
1.455835 |
29.94421 |
|
|
1.221396 |
3.5535 |
4.340231 |
1.491808 |
25.23465 |
|
|
sum |
34.93481 |
1299.542 |
897.6365 |
32.10143 |
25092.54 |
a is the
intercept and b is the slope .
.png)
The error in a and b using these equations:
.png)
.png)
For resolution computations and from internal
conversion spectrum :
|
I A |
N/I(1/A) |
|
0.53 |
243.3962 |
|
0.54 |
324.0741 |
|
0.55 |
361.8182 |
|
0.56 |
694.6429 |
|
0.57 |
808.7719 |
|
0.58 |
932.7586 |
|
0.59 |
867.7966 |
|
0.6 |
748.3333 |
|
0.61 |
542.623 |
|
0.62 |
287.0968 |
|
0.63 |
258.7302 |
|
0.64 |
242.1875 |
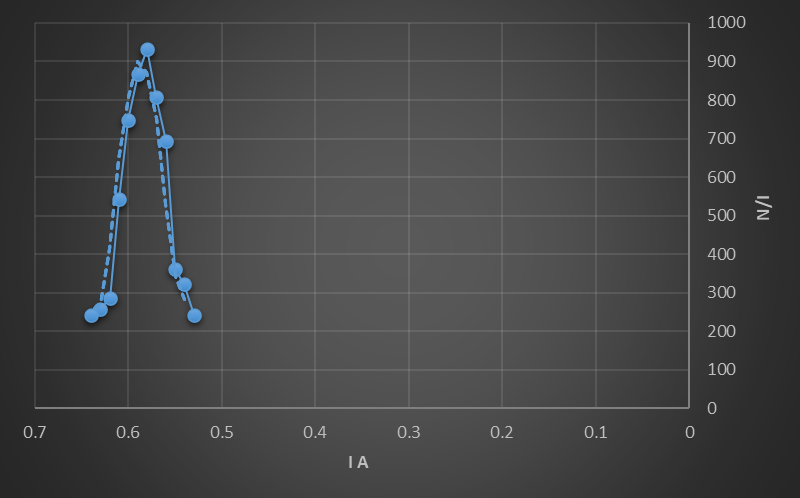
From the graph we can obtain the following information
:
(N / Imax) = 932.75 (1 /A)
Imax = 0.58 A
Height = (1/√2)(N/Imax) =
659.5538 (1/A)
The half max.=329.7769(1/A)
∆I at half max. value =(0.62-0.54)= 0.08A
R = ∆I/I
=0.1379
Conclusion
*
The beta particles are high energy, high speed electrons or positrons that are
ejected from nucleus by some radio nuclei.
*
Normally beta decay occurs in nuclei that have too many neutrons to achieve
stability.
*We
calculated the kinetic energy of electrons with percentage error= 35.01 %
* We
calculated the resolution of the spectrometer and obtained R=0.1379.
References
1- Arthur
Beiser; Concepts of Modern Physics, Sixth Edition.
2- Manual
of the advanced practical physics 5.
3- Modern
Physics, For Scientists and Engineers, Fourth Edition, Stephen T. Thornton.
4- https://wanda.fiu.edu/boeglinw/courses/Modern_lab_manual3/_images/Sr90_decay.png
Comments
Post a Comment
If you have any comment please write it down, we will happy to read it.